Using the Fred Data API sample code
Overview
We created this study to demonstrate how users can tap the vast, freely available online data resources published by any number of organizations, and use them directly in CQG IC charts, studies, conditions, and trading systems. Never has it been so easy to integrate quantitative fundamental data into your trading decisions.
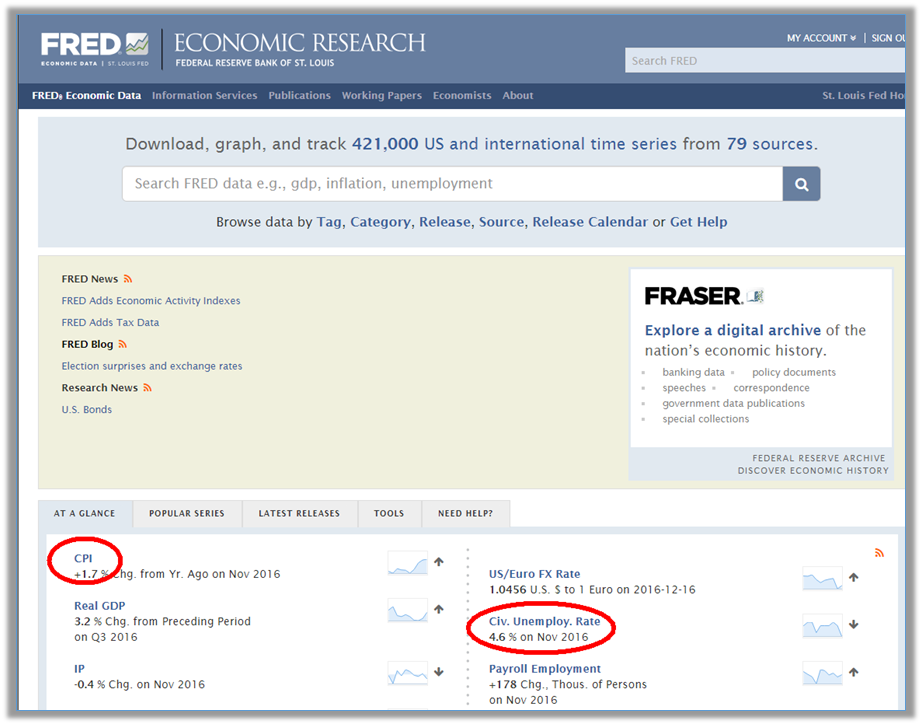
In this example, we show you how to connect to the United States Federal Reserve database (FRED) curated by the St. Louis branch. We especially appreciate their thorough and elegant job of organizing their data sets, providing a programmatic interface to access them, and making the process of acquiring their API key easy. Traders with no programming experience should be able to follow this guide to access FRED data. Traders with some programming knowledge should be able to modify the source code to access other data sources as well.
We will be following this guide with other examples demonstrating how to:
- access over 1.2 million time series datasets from the U.S. Department of Energy's U.S. Energy Information Administration;
- read any time series data file (.csv, .xls, .txt, etc.) stored locally into CQG IC; and
- access SQL server database data from within CQG IC.
Most of the data accessible via the Fred Data example is of monthly—or longer—frequency, so in most cases, it won't make sense to view the data in charts using intervals smaller than weekly bars.
Requirements
- Current subscription to CQG IC
- Visual Studio or other .Net IDE installed on your computer (the free "Express" version should work fine)
- Download the Fred Data API sample code below
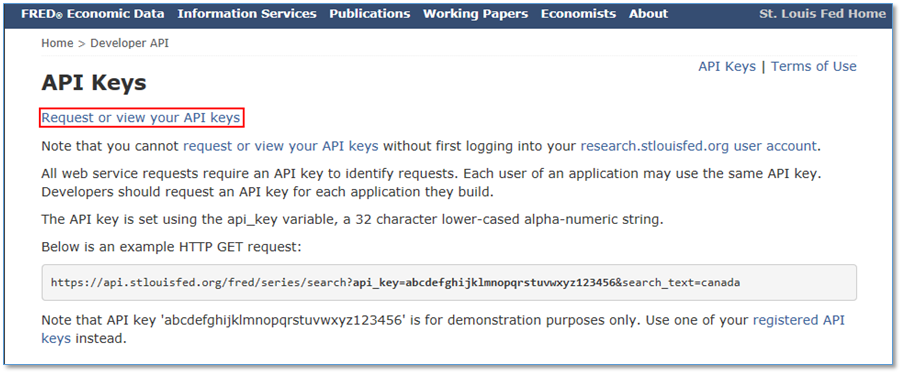
- Register for an API key from the Federal Reserve
- A User Operators folder where you will move the file you build with Visual Studio, usually located here: C:\Users\Public\Documents\CQGNet\Private\User Operators
1. Download the source code, and extract the files to your preferred location.
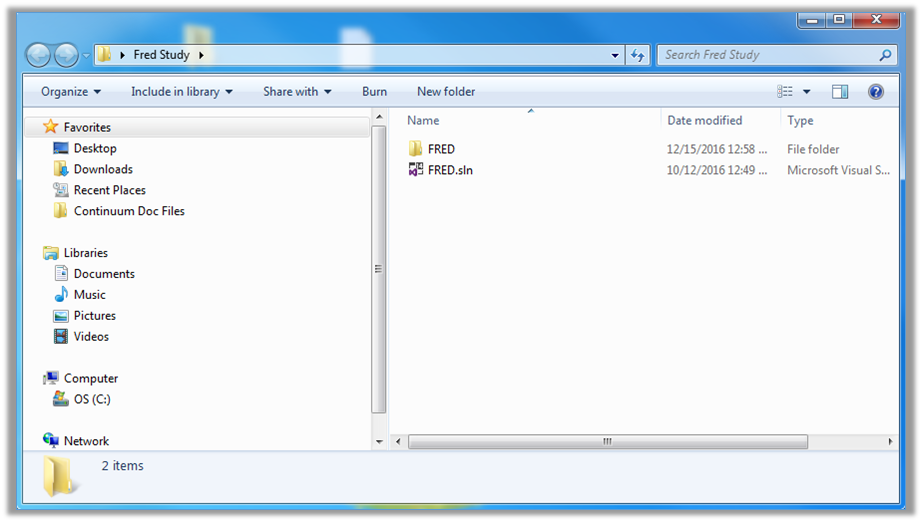
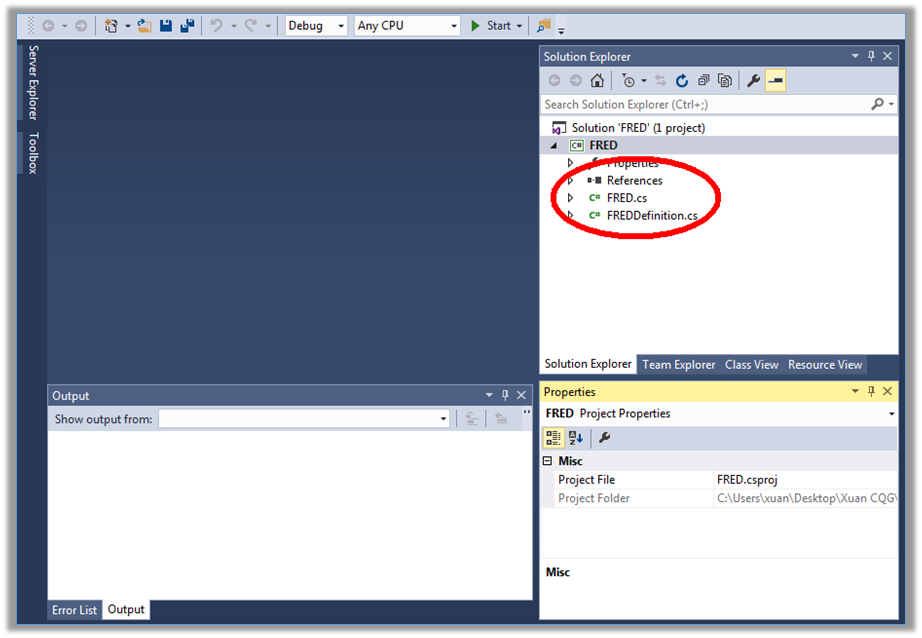
2. Open the .sln file in Visual Studio, and then open the Fred class (fred.cs).
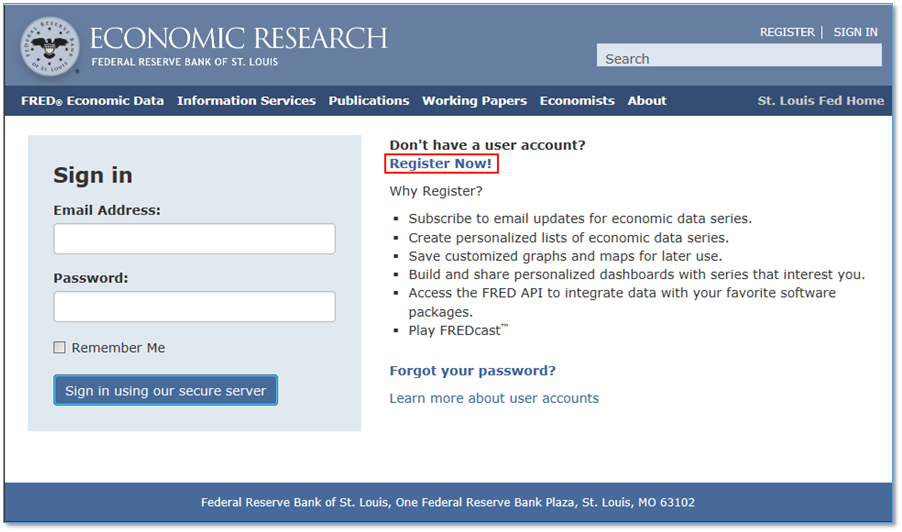
3. You need your own API key from the Fed. Click the link in line 27 if you don’t have one, and go to the “FRED” website to apply.
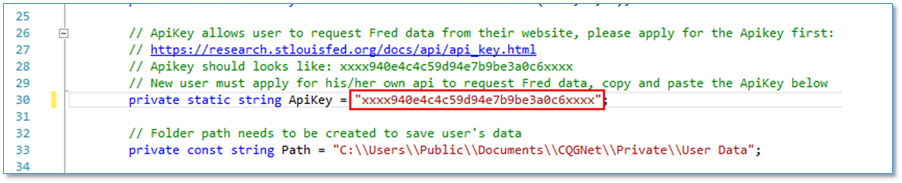
4. Retrieve your API key from the email you receive and in Visual Studio and copy it into the code at line 30, replacing “ApiKey.”
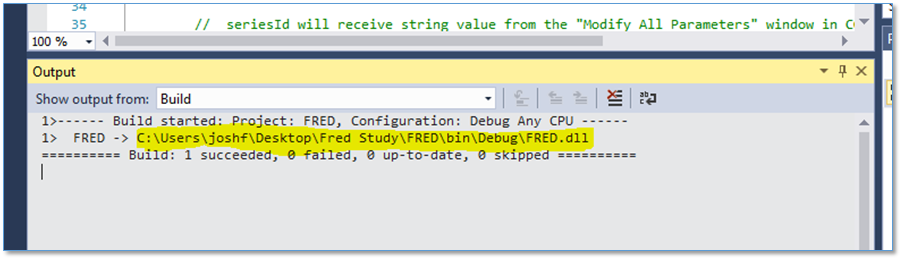
5. In Visual Studio, save (control-s) and build (control-shift-b) the project.
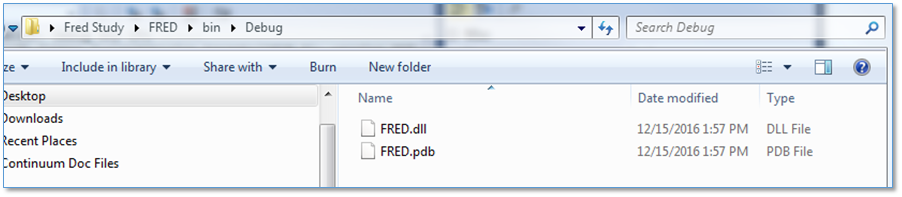
6. Find the dll path in the Output window, and copy the dll file to the User Operators folder.
7. Restart CQG IC.
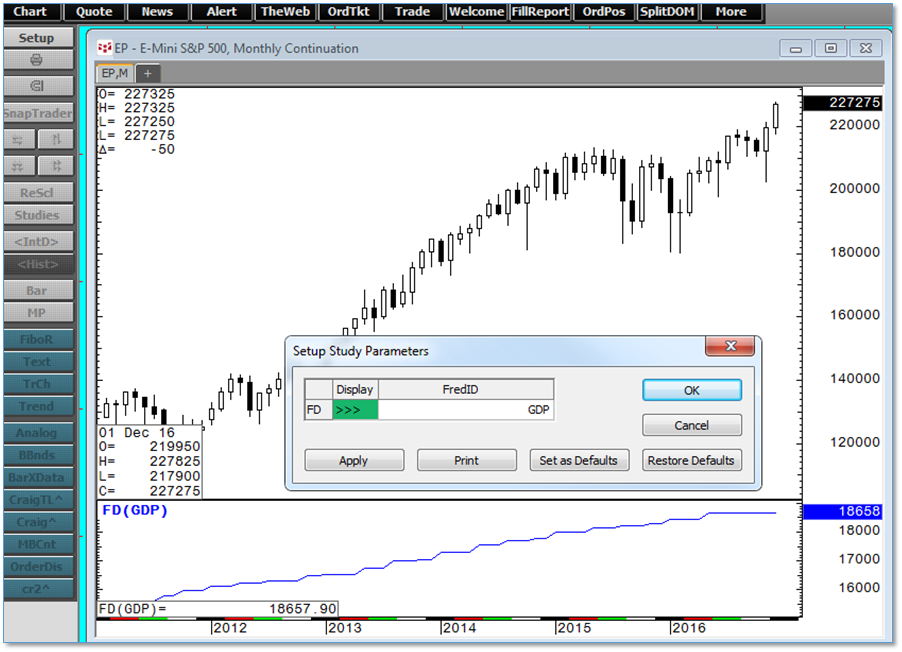
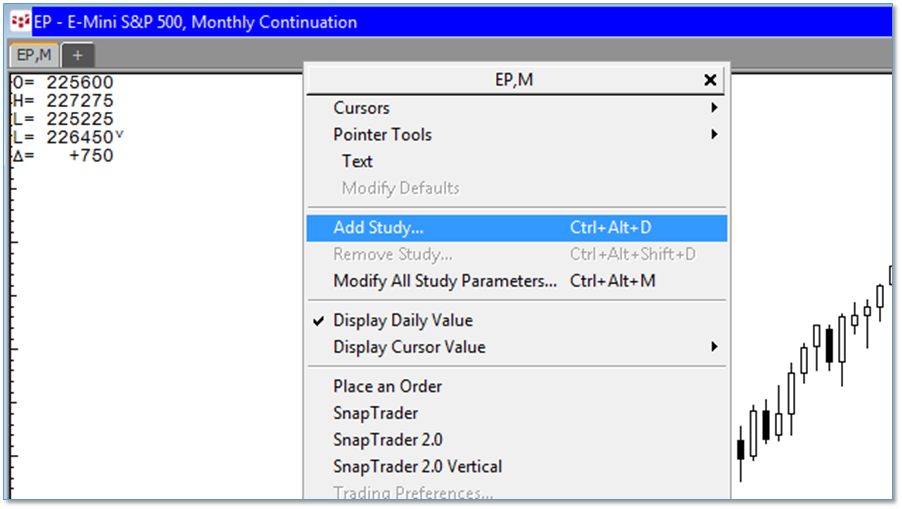
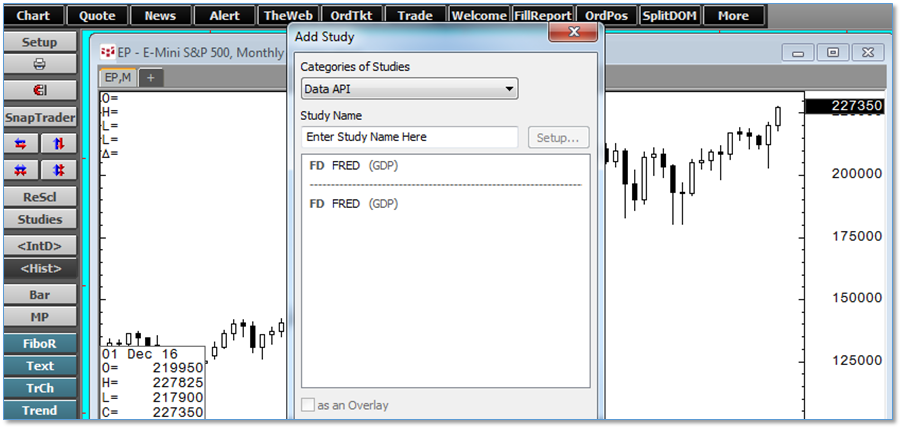
8. Add the Fred study from the "Data API" study folder.
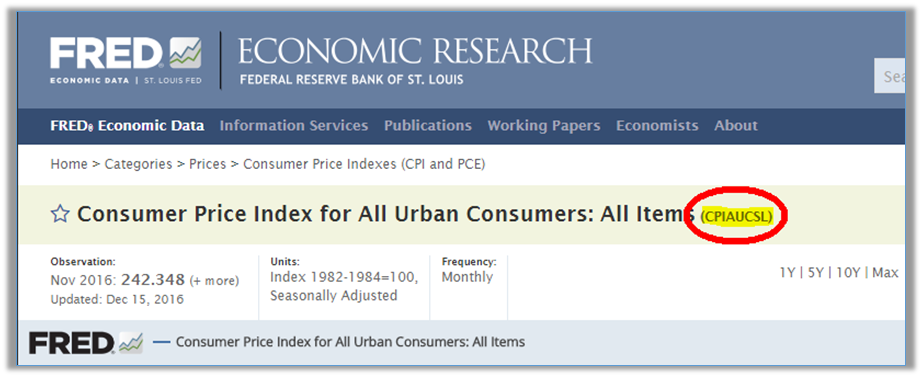
9. Identify the time series ID for the data set you’d like to see and copy it by right clicking or using control-c.
10. Modify the study and paste the time series ID using control-v. Currently users will encounter two bugs. Right click to paste clipboard contents does not work in the Add Study dialog. When you use control-v the clipboard contents will be pasted twice. The workaround is to delete half of what is pasted in this field.
11. You can add multiple time series to the same chart, use them in Formula Builder to create studies, conditions, add them to trading systems, etc. Let us know in the forums how you use it.